Difference between revisions of "Advanced Flight Simulation"
| Line 108: | Line 108: | ||
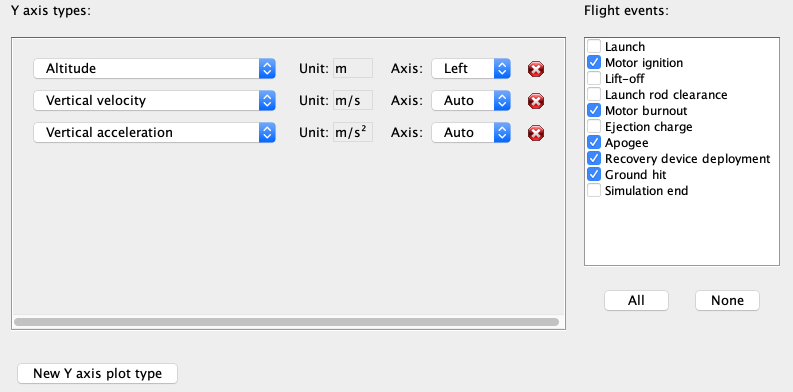
[[File:YaxisTypes.png|thumb|800 px|center|Setting Y-axes and Events for plotting]] <br /> | [[File:YaxisTypes.png|thumb|800 px|center|Setting Y-axes and Events for plotting]] <br /> | ||
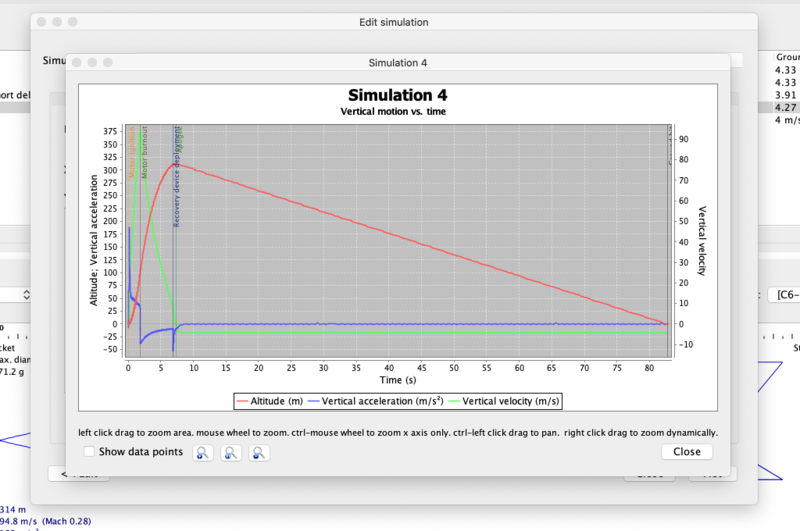
| − | Below you can see a plot of <em>A simple model rocket</em>, simulation number 4, flying on a C6-5.<br /><br /> | + | Below you can see a plot of <em>A simple model rocket</em>, simulation number 4, flying on a C6-5. Note that the five events checked in the above screen have been marked on the plot (<em>some very close to each other, or to the edge</em>): <strong>Motor ignition</strong>, <strong>Motor burnout</strong>, <strong>Apogee</strong>, <strong>Recovery device deployment</strong>, and <strong>Ground hit</strong>. <br /><br /> |
[[File:PlotOfSimulation.png|thumb|800 px|center|A <em>Plot</em> of the simulation.]] <br /> | [[File:PlotOfSimulation.png|thumb|800 px|center|A <em>Plot</em> of the simulation.]] <br /> | ||
Revision as of 02:41, 11 January 2021
|
The current User's Guide is very much a work in progress, any help would be greatly appreciated! |
Advanced Flight Simulation
OpenRocket offers more advanced options for simulating flight. You can plot your rocket's predicted acceleration, climb, eject and landing, make a prediction for how far downrange and in which direction your flight will land, and even experiment with different models of Earth's geometry, as it affects your flight. Once you're satisfied with a sim, you can export your data for analysis and charting in other packages.
Plotting your rocket's flight
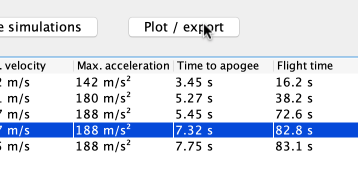
To begin learning about OpenRocket's plotting features, first, click the Plot / Export button on the Flight simulations window.
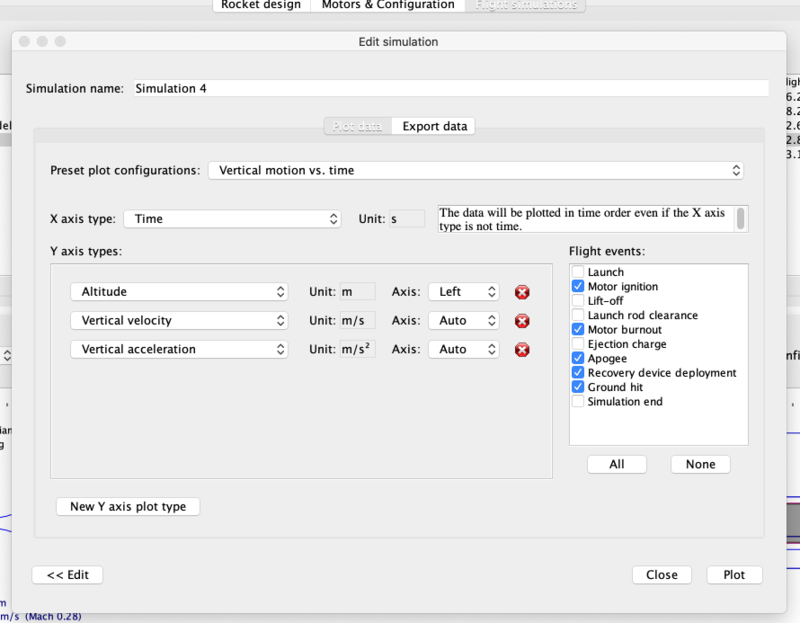
On the Edit simulation panel, you'll see tabs marked Plot data and Export data. The Plot data opens first. Here you can define many parameters that will determine what values are plotted, and what events are marked on the plot.
Here you'll be able to quickly choose from a number of standard plots:
You'll also be able to assign to the X and Y axes any one of over 50 parameters:
- Time
- Altitude
- Vertical velocity
- Vertical acceleration
- Total velocity
- Total acceleration
- Lateral distance
- Lateral direction
- Lateral velocity
- Lateral acceleration
- Latitude
- Longitude
- Gravitational acceleration
- Angle of attack
- Roll rate
- Pitch rate
- Yaw rate
- Mass
- Propellant mass
- Longitudinal moment of inertia
- Rotational moment of inertia
- CP location
- CG location
- Stability margin calibers
- Mach number
- Reynolds number
- Thrust
- Drag force
- Drag coefficient
- Axial drag coefficient
- Friction drag coefficient
- Pressure drag coefficient
- Base drag coefficient
- Normal force coefficient
- Pitch moment coefficient
- Yaw moment coefficient
- Side force coefficient
- Roll moment coefficient
- Roll forcing coefficient
- Roll damping coefficient
- Pitch damping coefficient
- Reference length
- Reference area
- Vertical orientation (zenith)
- Lateral orientation (azimuth)
- Wind velocity
- Air temperature
- Air pressure
- Speed of sound
- Simulation time step
- Computation time
- Position parallel to wind
- Position upwind
You can assign multiple parameters to the Y-axis, and choose whether their scales appear on the left, or the right side of the plot. You can add Y-axis parameters with the New Y-axis plot type button, or delete parameters from the plot with the X buttons. (The X-axis takes only a single plotted parameter, typically Time).
Additionally, you can choose from several flight events, any or all of which can be called out on your plot, in reference to the simulated time of occurrence.
Below you can see a plot of A simple model rocket, simulation number 4, flying on a C6-5. Note that the five events checked in the above screen have been marked on the plot (some very close to each other, or to the edge): Motor ignition, Motor burnout, Apogee, Recovery device deployment, and Ground hit.
